How to Calculate a Location Factor (LF)
Location factors (LF) are a fundamental product of any Estimating / Cost Engineering Consulting organization supporting industries with global assets and capital projects.
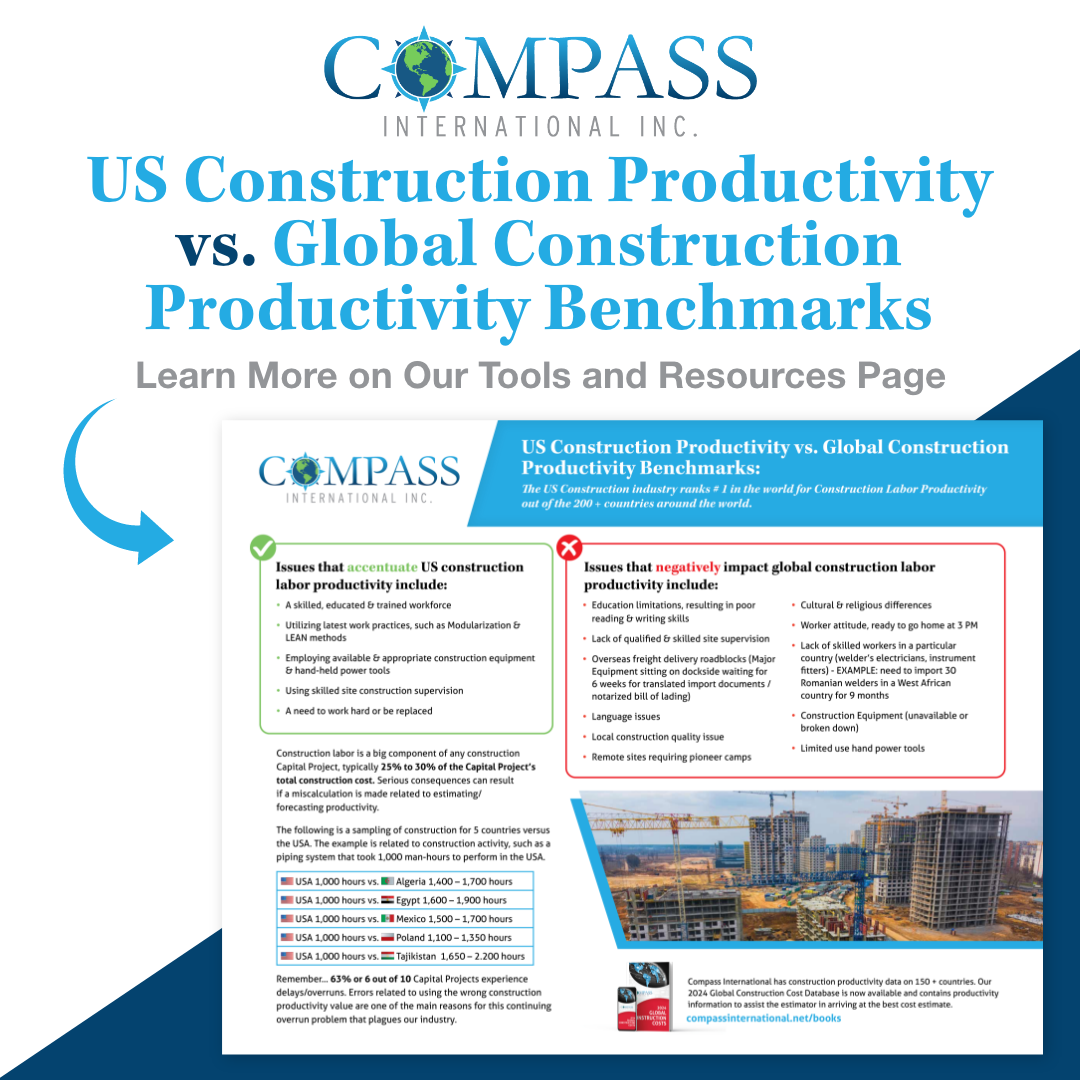
US Construction Productivity vs. Global Construction Productivity Benchmarks
The US Construction industry ranks # 1 in world for Construction Labor Productivity out of the 200+ countries around the world.
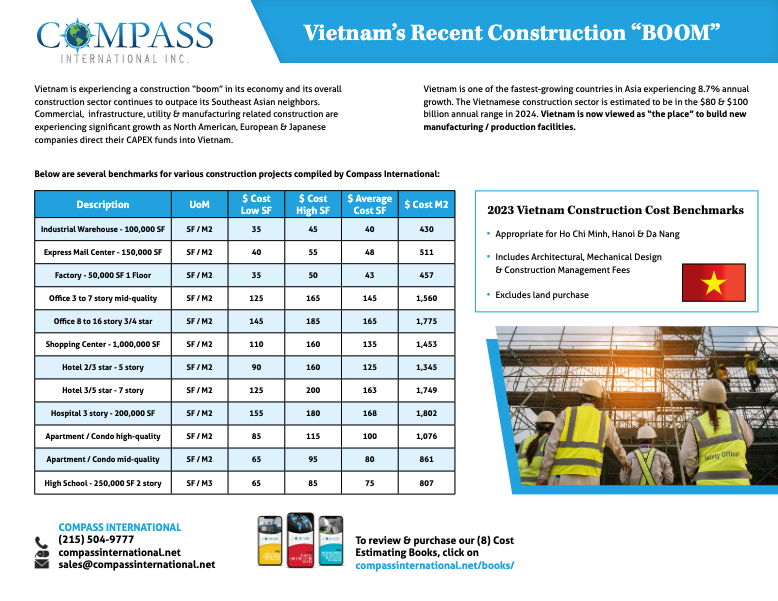
Vietnam’s Recent Construction “Boom”
Vietnam is experiencing a construction “boom” in its economy and its overall construction sector continues to outpace its Southeast Asian neighbors.
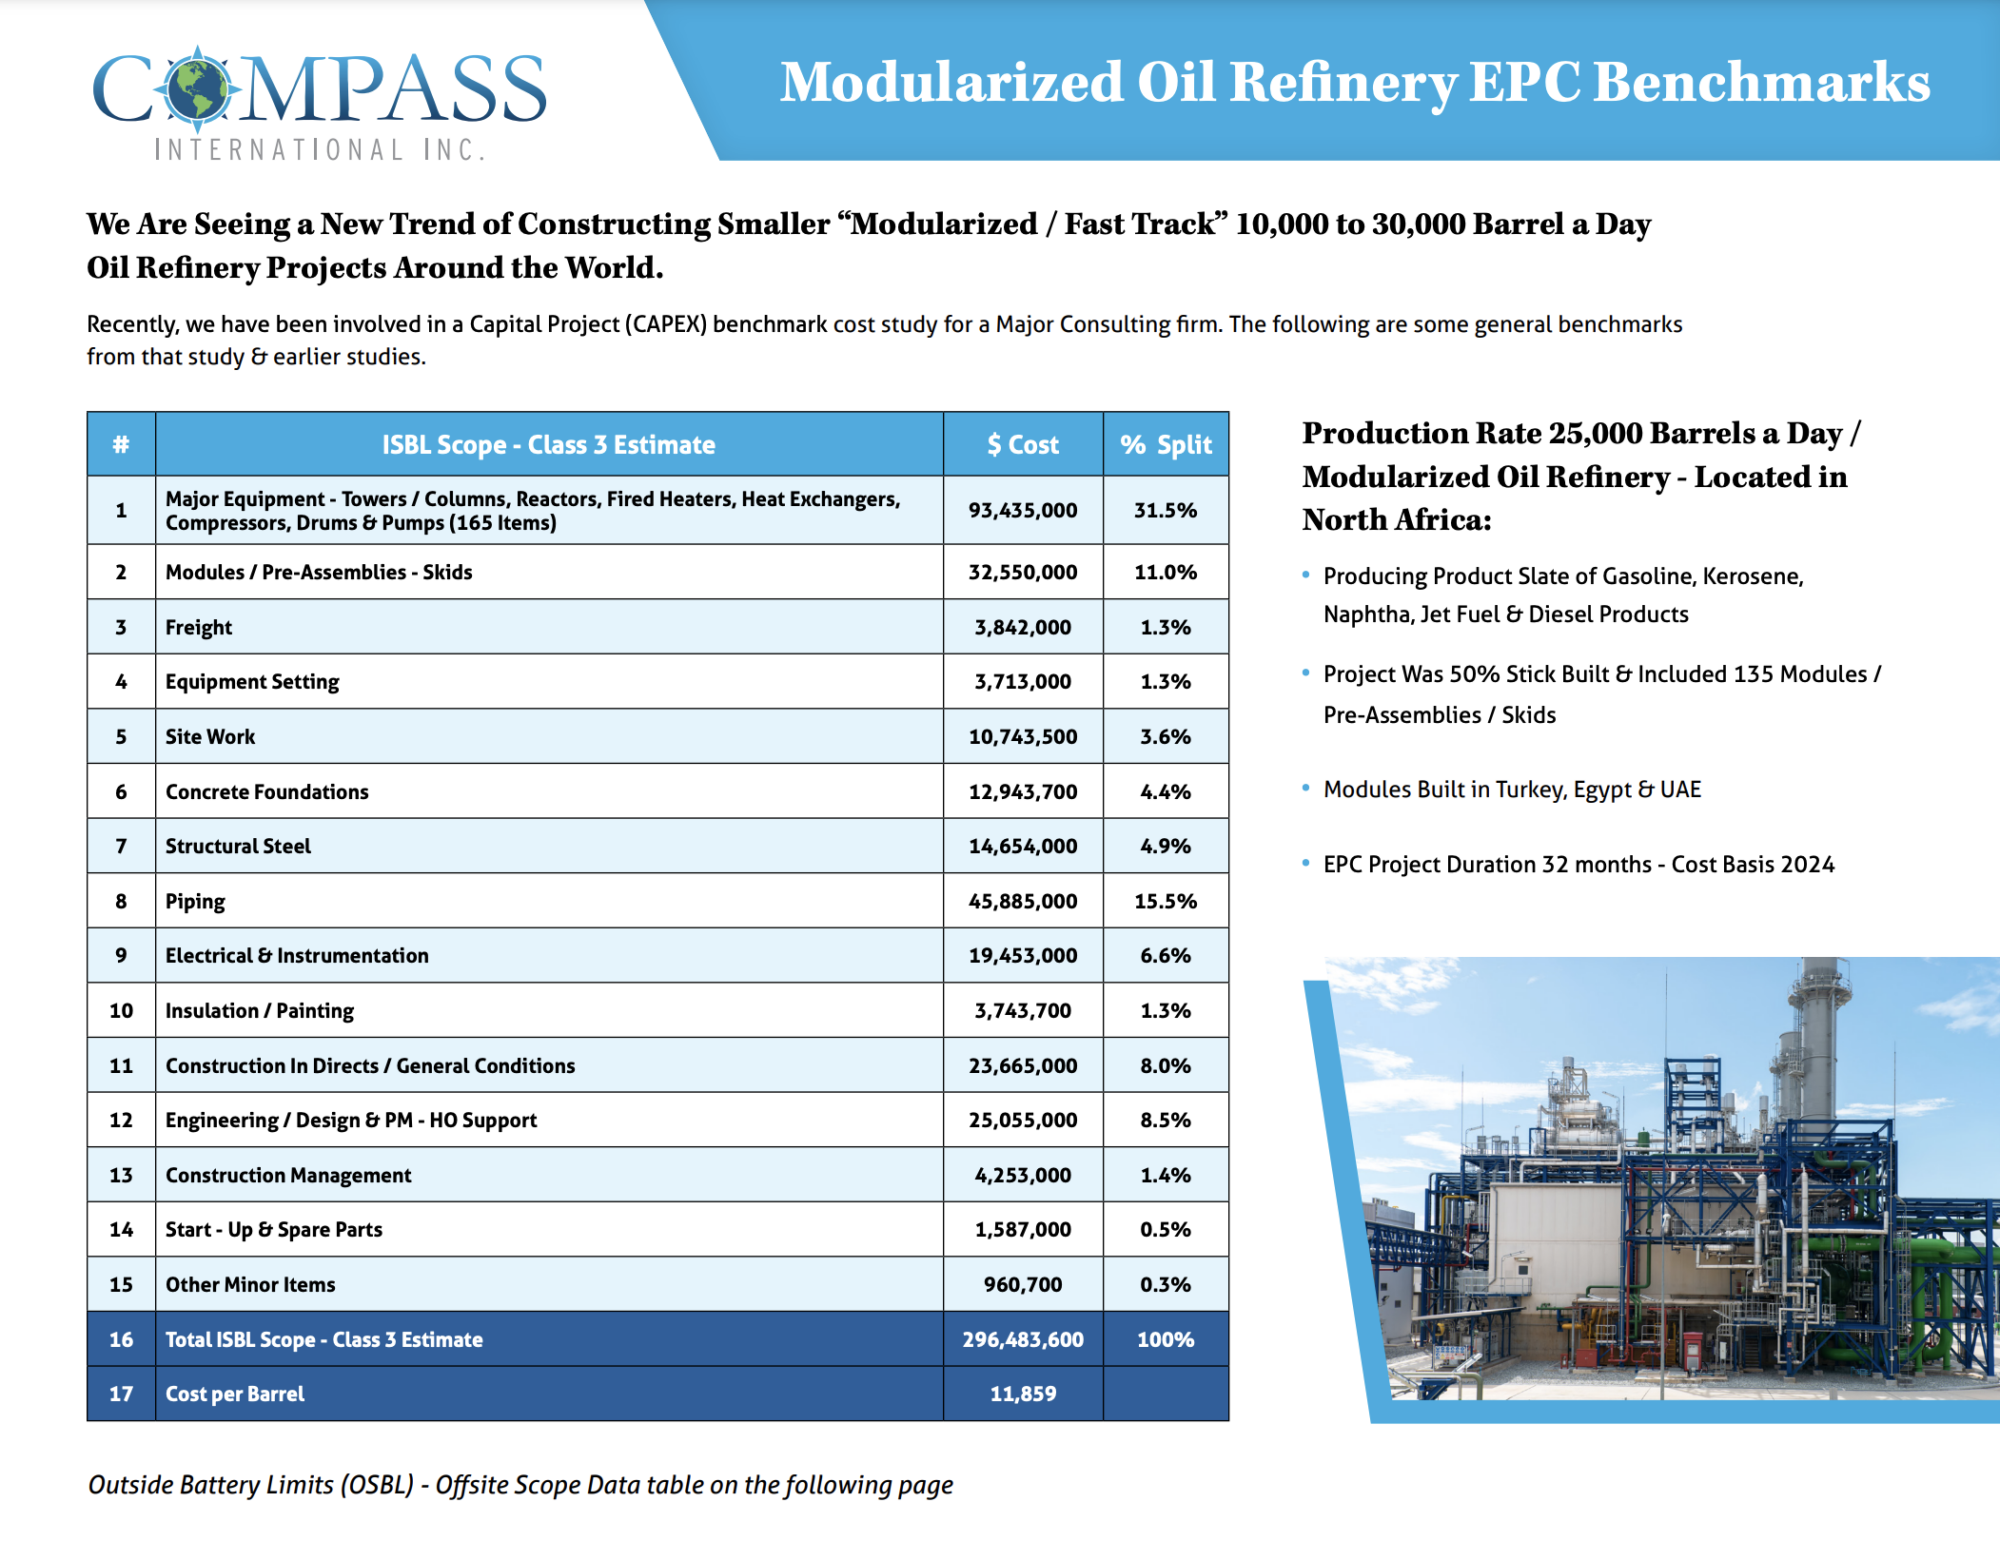
Modularized Oil Refinery EPC Benchmarks
We Are Seeing a New Trend of Constructing Smaller “Modularized / Fast Track” 10,000 to 30,000 Barrel a Day Oil Refinery Projects Around the World.
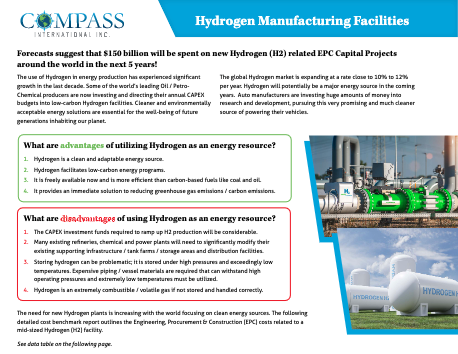
Hydrogen Manufacturing Facilities
Forecasts suggest that $150 billion will be spent on new Hydrogen (H2) related EPC Capital Projects around the world in the next 5 years!
Improving Construction Productivity
Over the years, numerous papers, studies, and publications have been written on this important subject. Construction productivity is unfortunately well below other industry standards. Why is this, and how can construction productivity be improved?
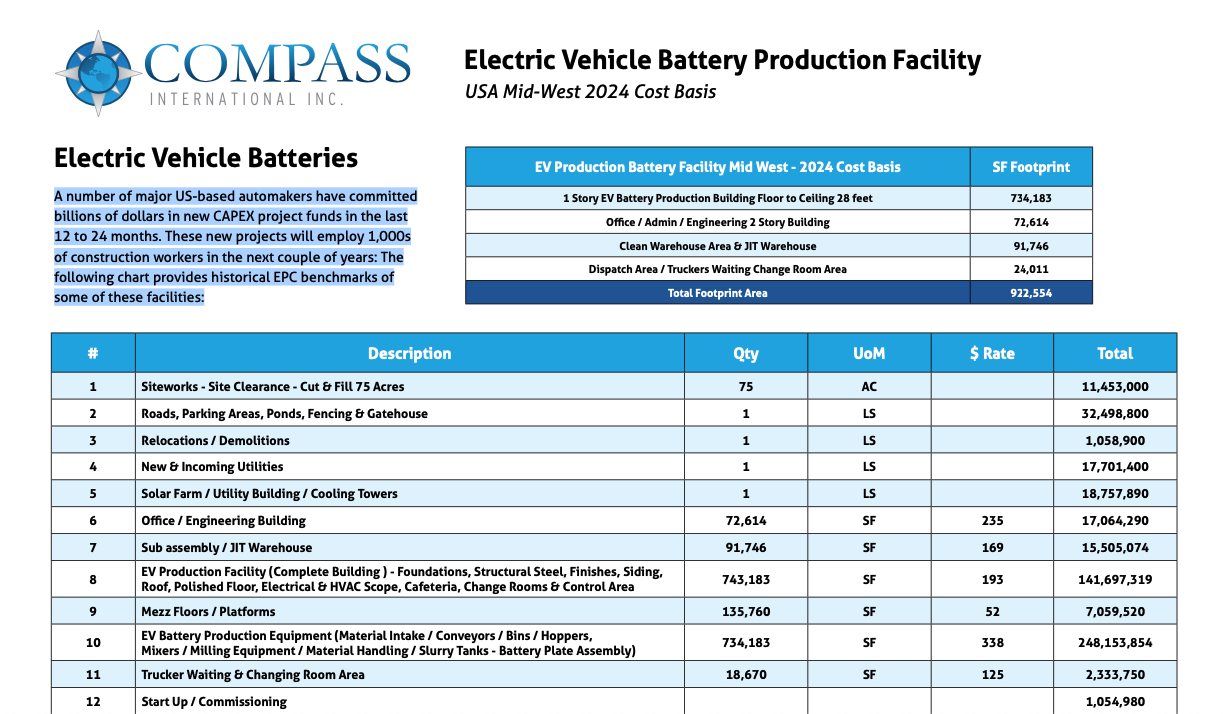
Electric Vehicle Batteries
A number of major US-based automakers have committed billions of dollars in new CAPEX project funds in the last 12 to 24 months. These new projects will employ 1,000s of construction workers in the next couple of years: The following chart provides historical EPC benchmarks of some of these facilities:
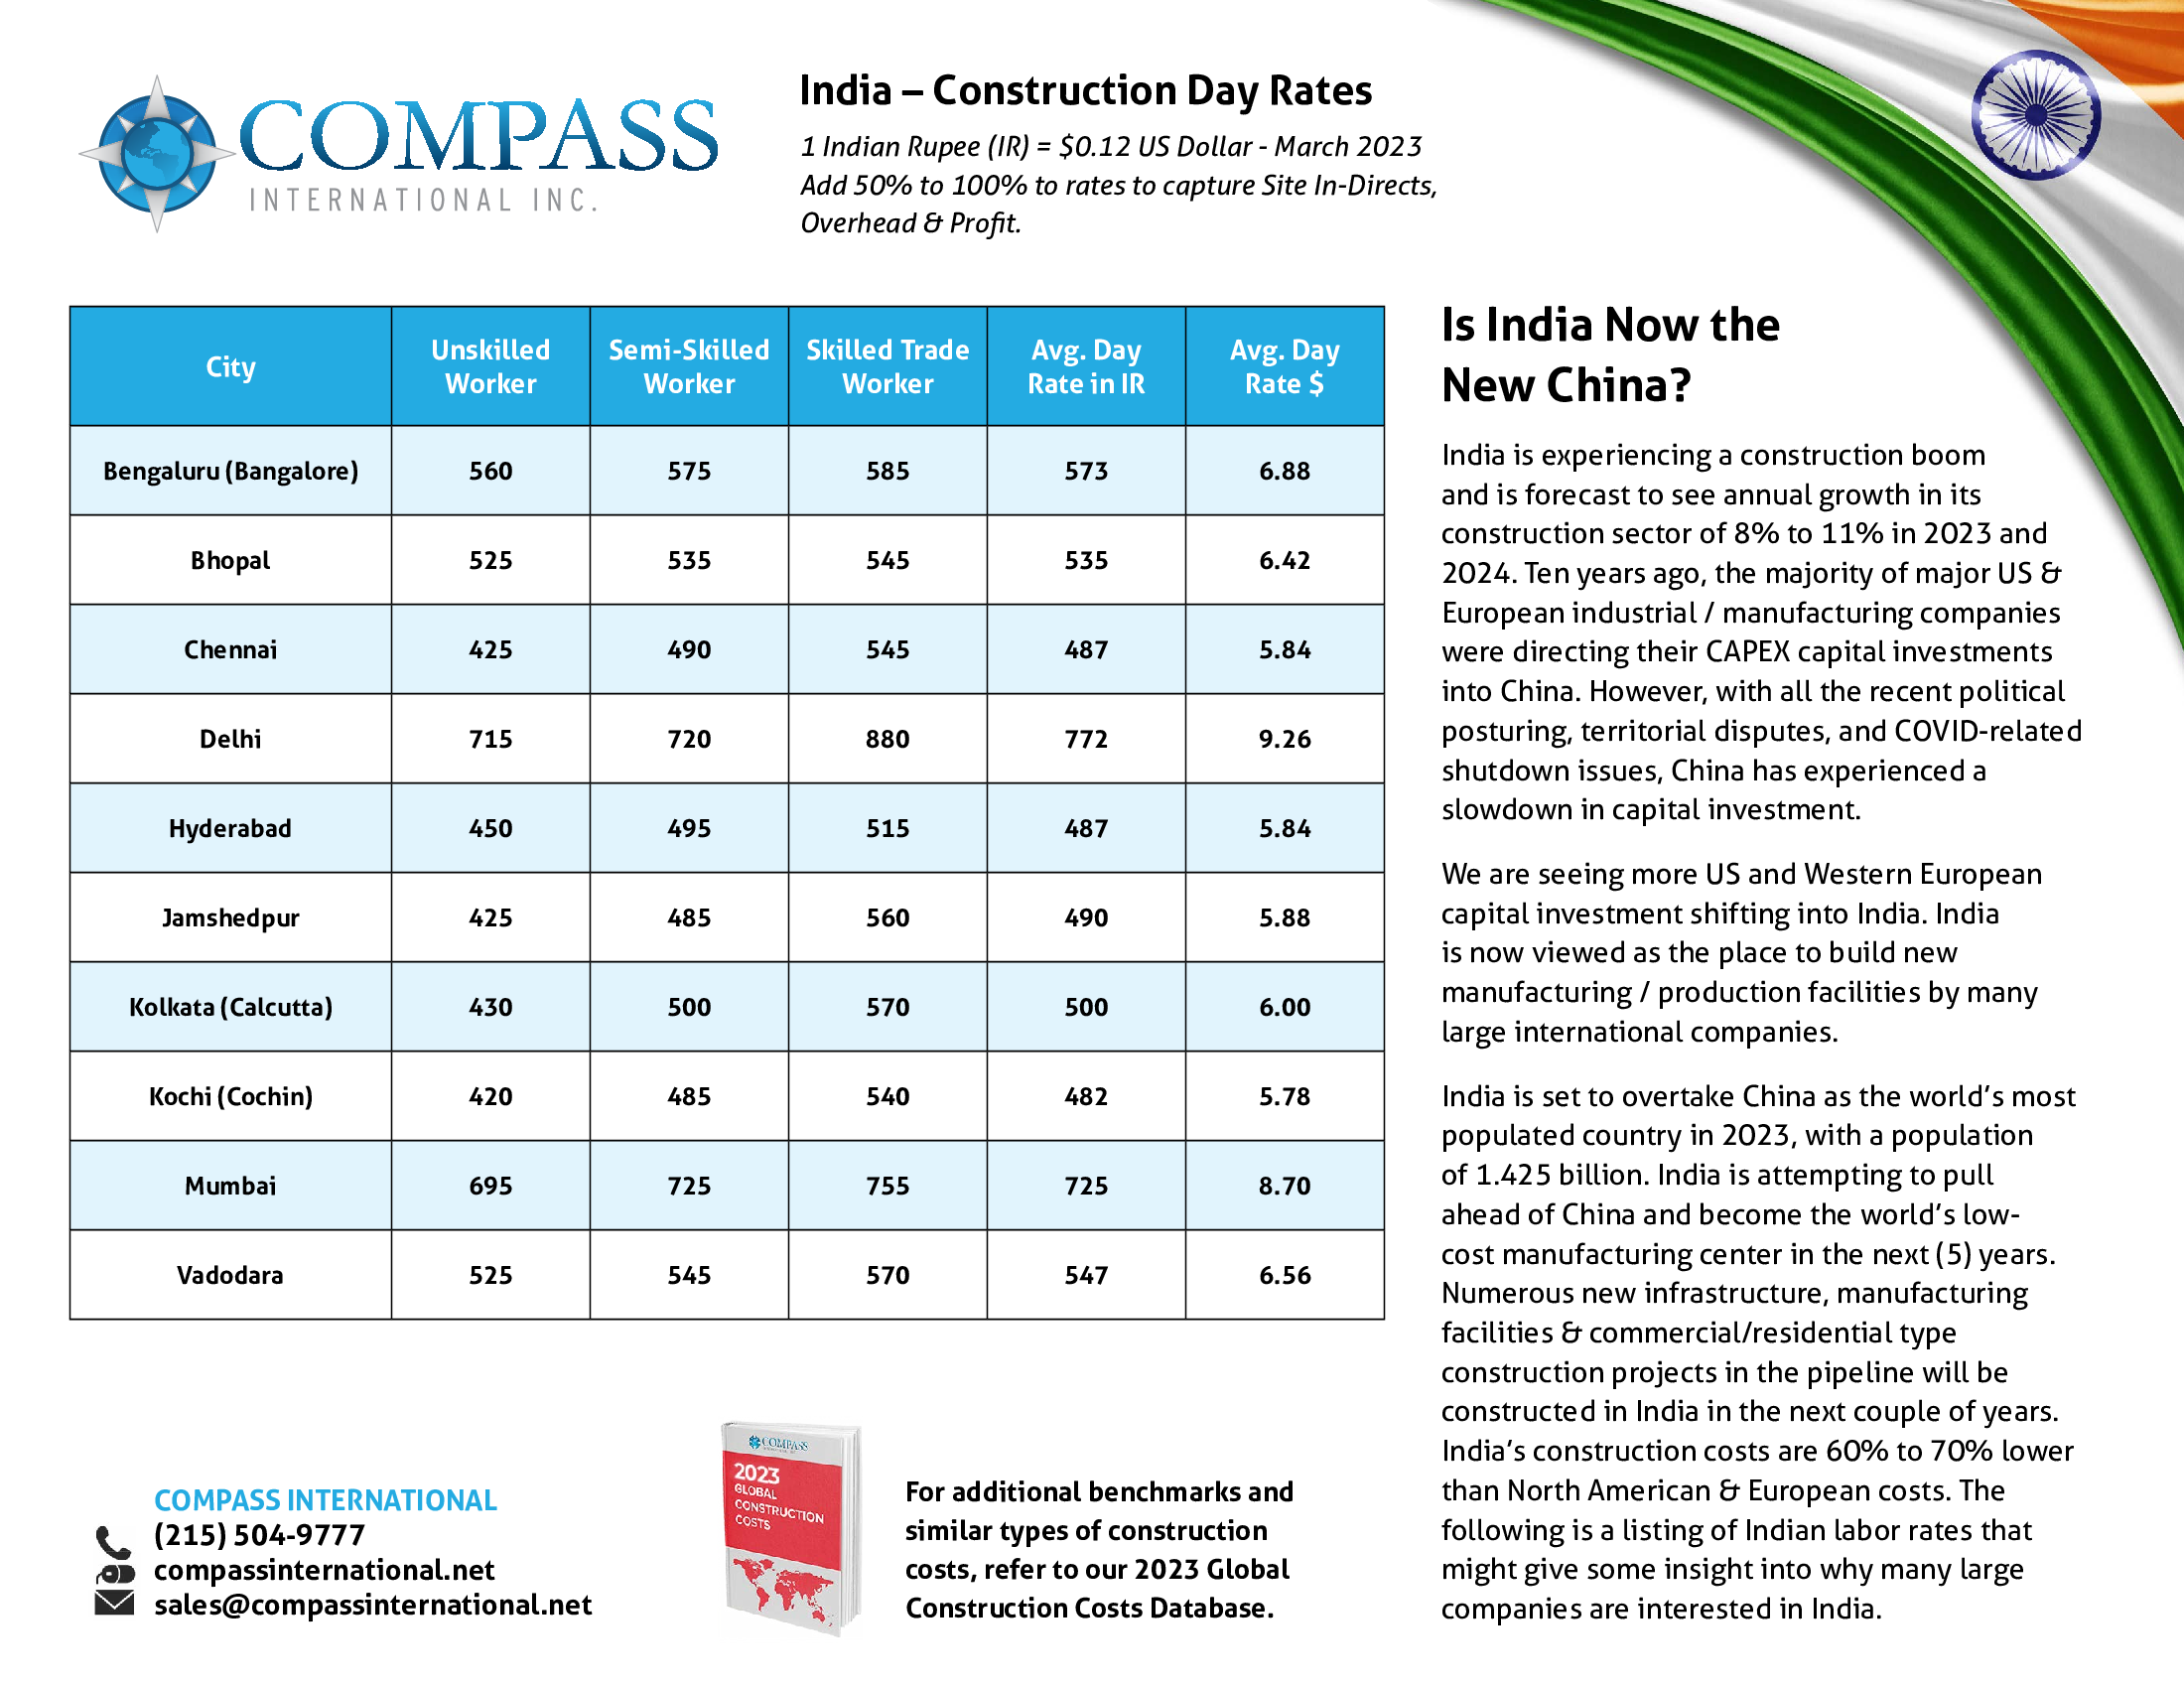
India Construction Day Rates – 2023 Cost Basis
India is experiencing a construction boom and is forecast to see annual growth in its construction sector of 8% to 11% in 2023 and 2024. Ten years ago, the majority of major US & European industrial / manufacturing companies were directing their CAPEX capital investments into China. However, with all the recent political posturing, territorial disputes, and COVID-related shutdown issues, China has experienced a slowdown in capital investment
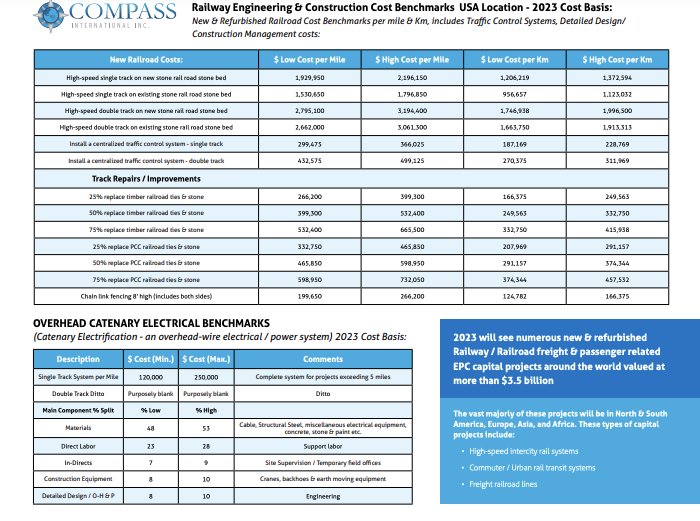
Railway Engineering & Construction Cost Benchmarks USA Location – 2023 Cost Basis
New & Refurbished Railroad Cost Benchmarks per mile & Km, includes Traffic Control Systems, Detailed Design / Construction Management costs
Download
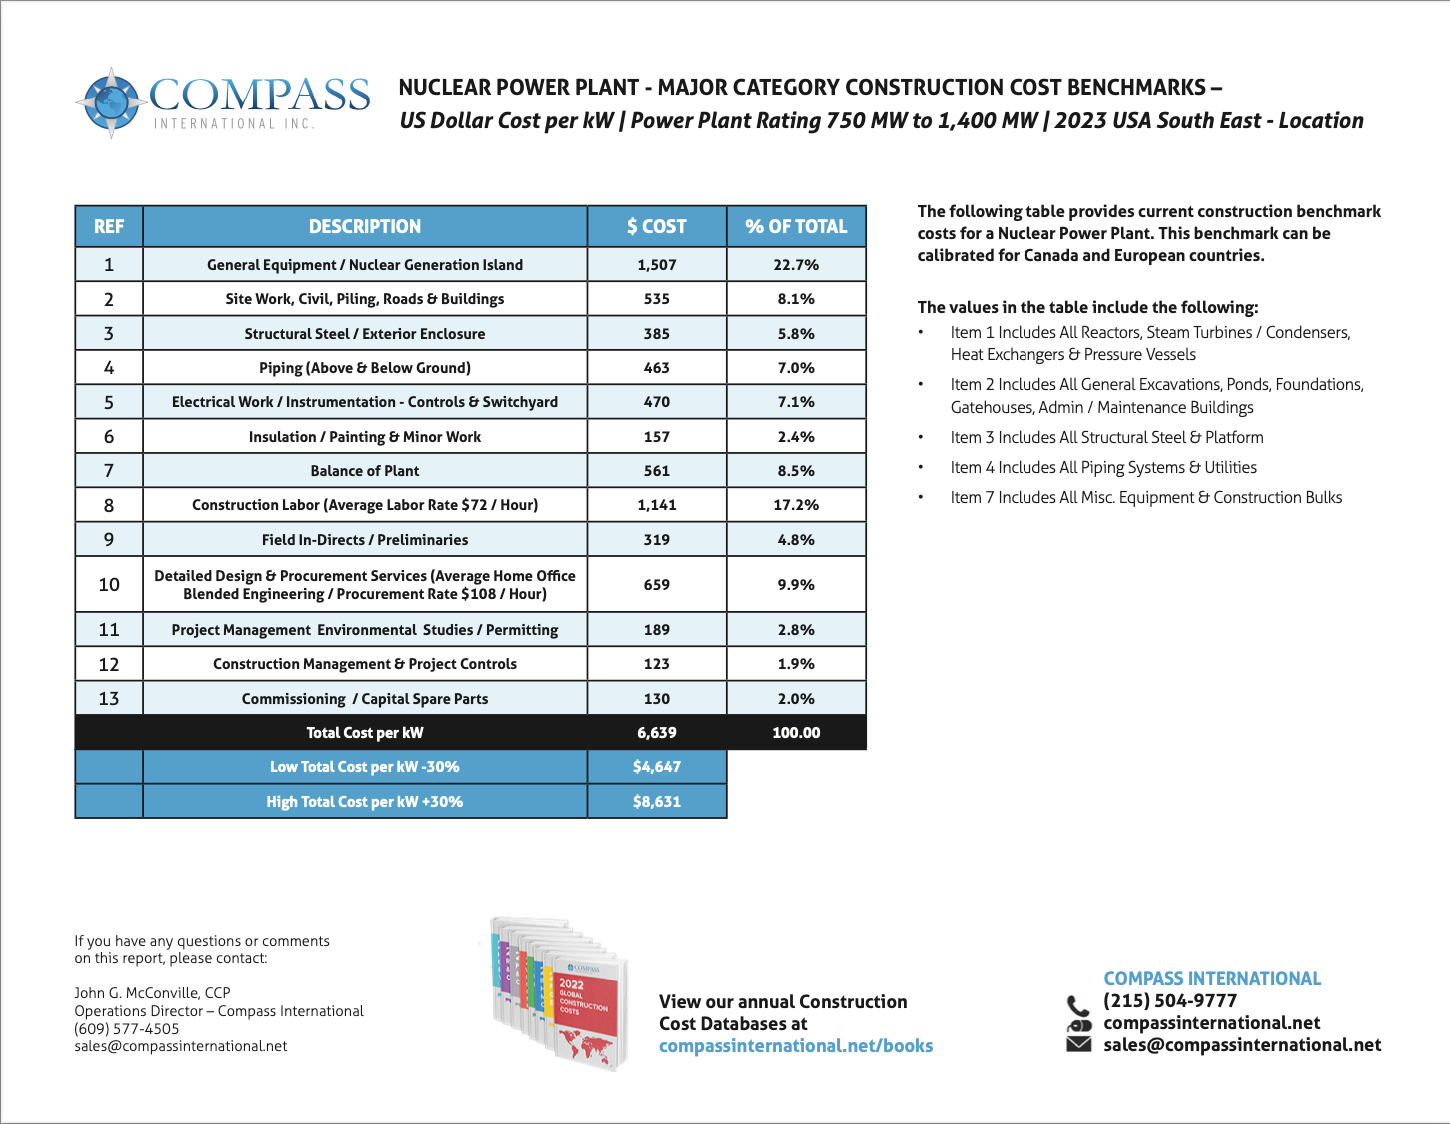
Nuclear Power Plant – Major Category Construction Cost Benchmarks
The US & Western Europe have been striving to reduce their dependence on Russian gas while the war in Ukraine continues for more than 9 months. There is a renewed consensus to construct additional nuclear power plants in the US to satisfy current and future energy needs in the midst of the ongoing natural gas crisis.
Download
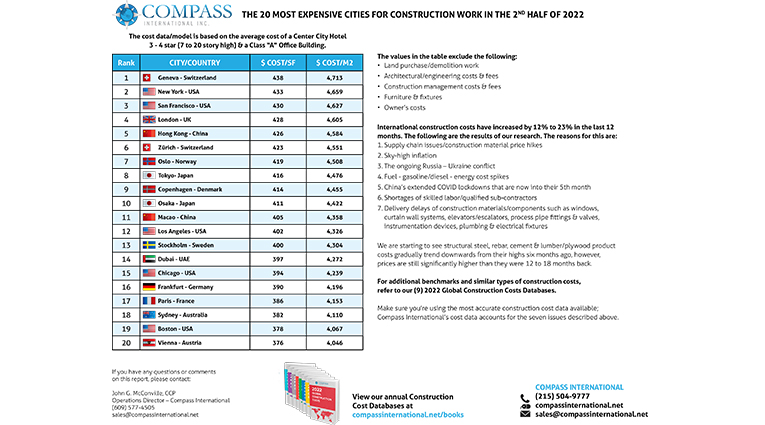
The 20 Most Expensive Cities for Construction Work in the 2nd Half of 2022
It’s no surprise that Global Construction Prices have increased substantially in the past 18 months! Sky-high inflation, fuel price spikes, supply chain problems & the ongoing Ukraine conflict have created a perfect storm, driving up international construction costs. Compass International has researched and compiled this report on the TOP 20 most expensive cities to carry out construction projects.Download
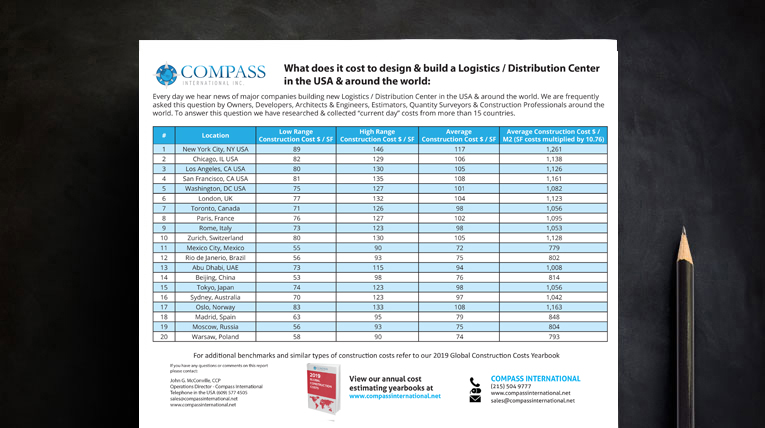
What does it cost to design & build a Logistics / Distribution Center in the USA & around the world
Every day we hear news of major companies building new Logistics / Distribution Center in the USA & around the world. We are frequently asked this question by Owners, Developers, Architects & Engineers, Estimators, Quantity Surveyors & Construction Professionals around the world. To answer this question we have researched & collected “current day” costs from more than 15 countries.Download
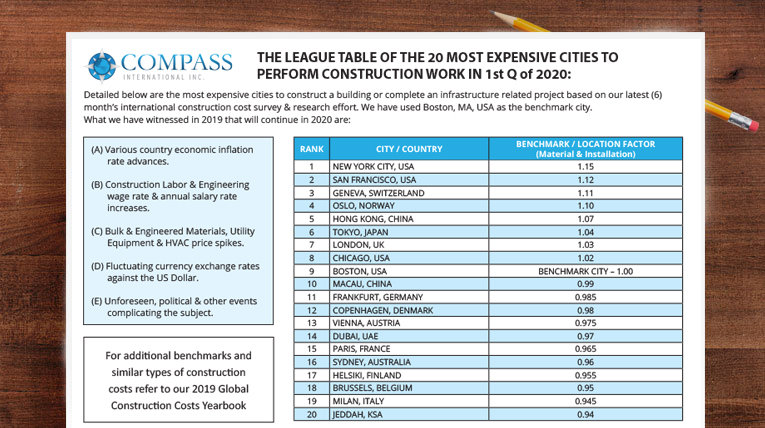
The League Table of The 20 Most Expensive Cities to Perform Construction Work in 1st Q of 2020
Detailed below are the most expensive cities to construct a building or complete an infrastructure-related project based on our latest (6) month’s international construction cost survey & research effort. We have used Boston, MA, USA as the benchmark city. What we have witnessed in 2019 that will continue in 2020 are the following.Download
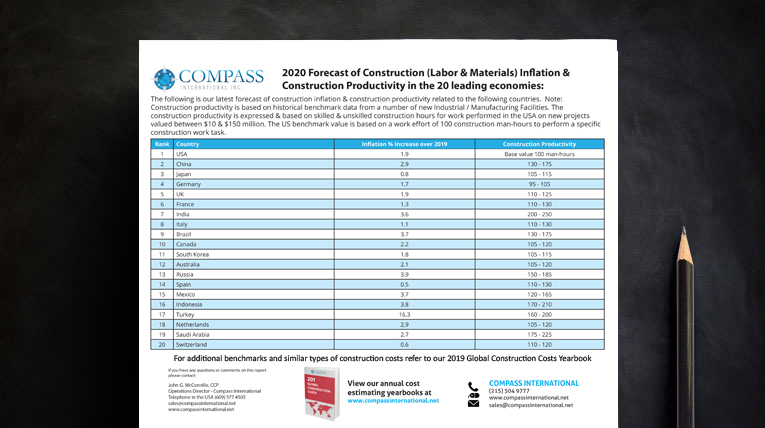
2020 Forecast of Construction (Labor & Materials) Inflation & Construction Productivity in the 20 leading economies:
The following is our latest forecast of construction inflation & construction productivity related to the following countries. Note: Construction productivity is based on historical benchmark data from a number of new Industrial / Manufacturing Facilities. The construction productivity is expressed & based on skilled & unskilled construction hours for work performed in the USA on new projects valued between $10 & $150 million. The US benchmark value is based on a work effort of 100 construction man-hours to perform a specific construction work task.Download
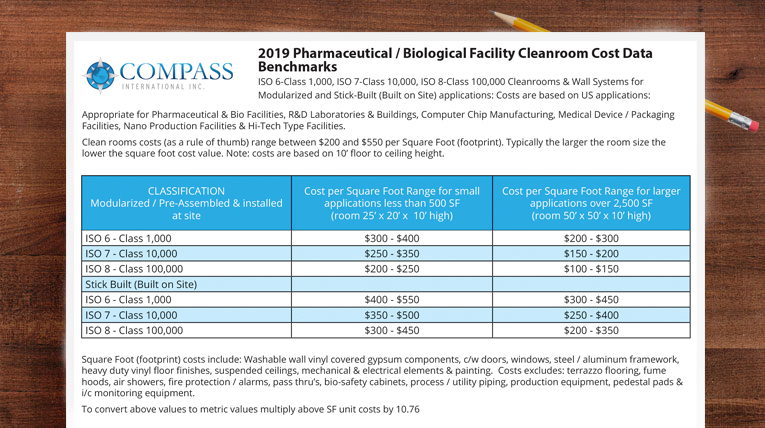
2019 Pharmaceutical / Biological Facility Cleanroom Cost Data Benchmarks
Take advantage of our latest Pharmaceutical / Biologicals Cleanroom square foot cost benchmark values that we have researched and collected from more than (6) recently constructed facilities located in North AmericaDownload
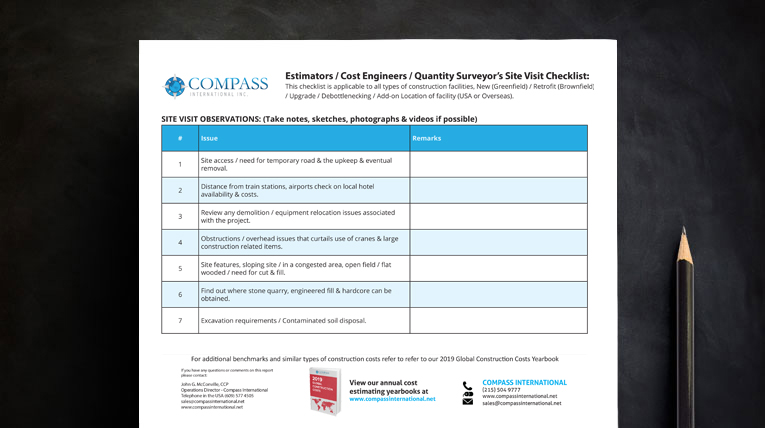
Estimators / Cost Engineers / Quantity Surveyor’s Site Visit Checklist
This checklist is applicable to all types of construction facilities, New (Greenfield) / Retrofit (Brownfield) / Upgrade / Debottlenecking / Add-on Location of facility (USA or Overseas).Download
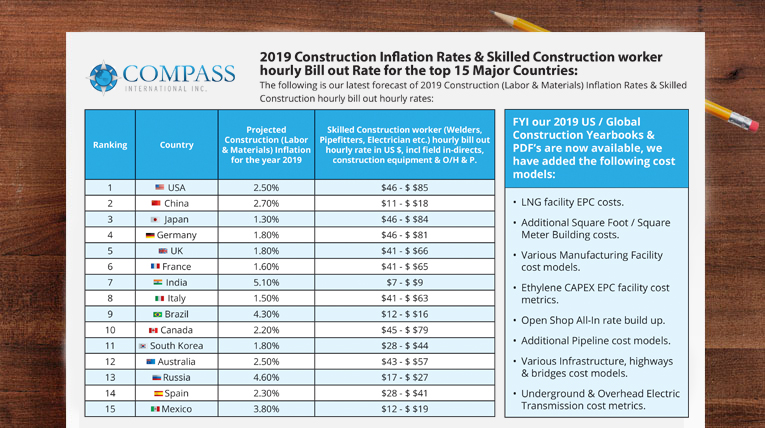
2019 Construction Inflation Rates & Skilled Construction worker hourly Bill out Rate for the top 15 Major Countries:
The following is our latest forecast of 2019 Construction (Labor & Materials) Inflation Rates & Skilled Construction hourly bill out hourly rates:Download
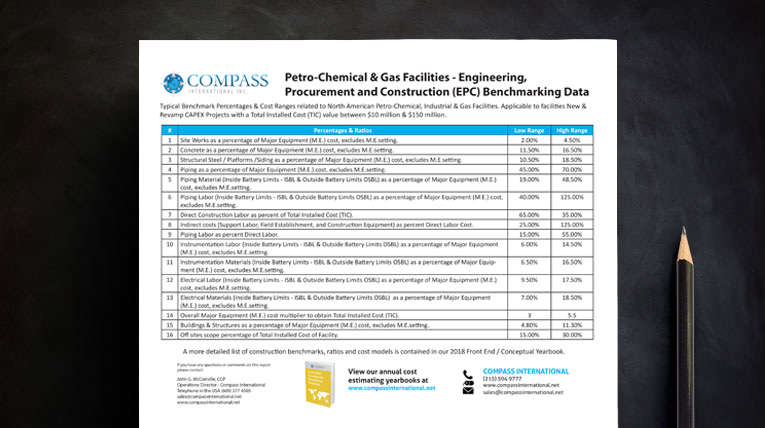
Oil & Gas Industry Benchmark # 1 Petro-Chemical & Gas Facilities – Engineering, Procurement and Construction (EPC) Benchmarking Data: (Data collected from 12 completed EPC projects in USA & Canada)
Typical Benchmark Percentages & Cost Ranges related to North American Petro-Chemical, Industrial & Gas Facilities. Applicable to New & Revamp CAPEX / Facility Projects with a Total Installed Cost (TIC) value between $10 million & $150 million.Download
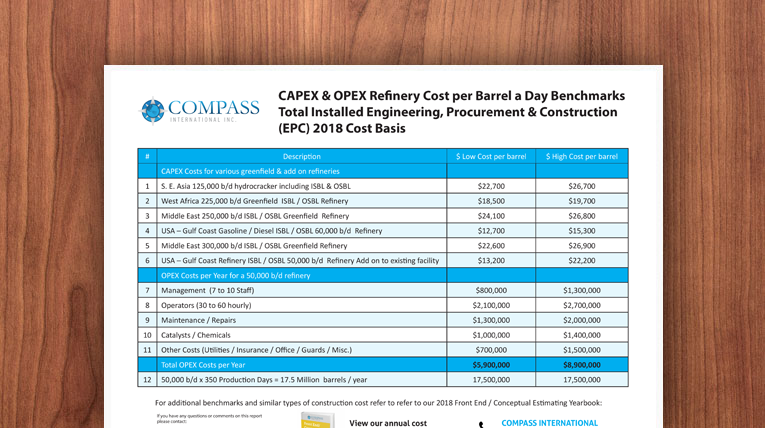
CAPEX & OPEX Refinery Cost per Barrel a Day Benchmarks Total Installed Engineering, Procurement & Construction (EPC) 2018 Cost Basis
The following table indicates a range of EPC Capital Expenditure (CAPEX) and Operating Costs (OPEX) per barrel of production for various international refineries.Download
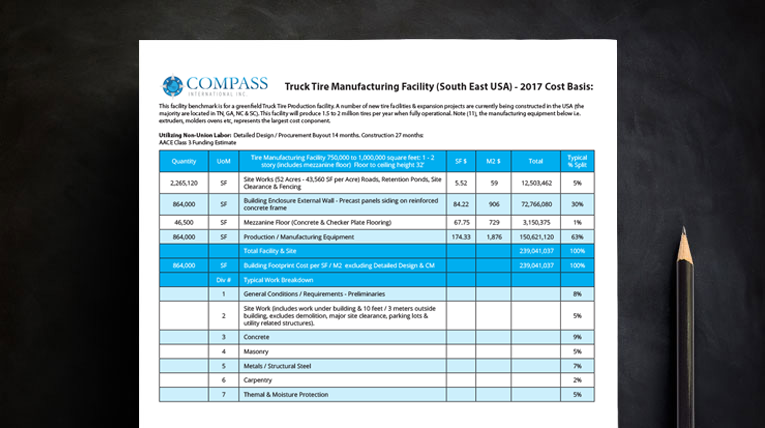
Truck Tire Manufacturing Facility (South East USA) – 2017 Cost Basis:
This facility benchmark is for a greenfield Truck Tire Production facility. A number of new tire facilities & expansion projects are currently being constructed in the USA (the majority are located in TN, GA, NC & SC). This facility will produce 1.5 to 2 million tires per year when fully operational. Note (11), the manufacturing equipment below i.e. extruders, molders ovens etc, represents the largest cost conponent.Download
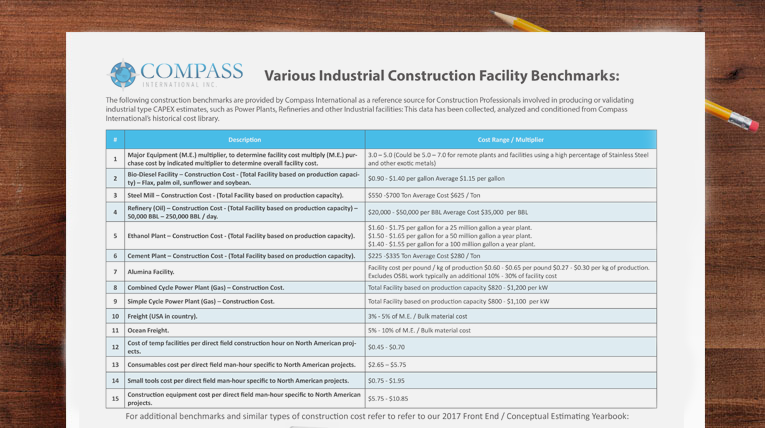
Various Industrial Construction Facility Benchmarks:
The following construction benchmarks are provided by Compass International as a reference source for Construction Professionals involved in producing or validating industrial type CAPEX estimates, such as Power Plants, Refineries and other Industrial facilities: This data has been collected, analyzed and conditioned from Compass International’s historical cost library.Download
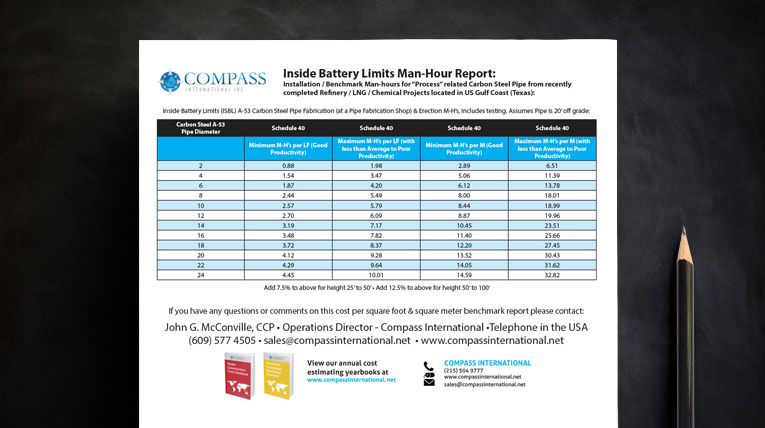
Inside Battery Limits Man-Hour Report:
Installation / Benchmark Man-hours for “Process” related Carbon Steel Pipe from recently completed Refinery / LNG / Chemical Projects located in US Gulf Coast (Texas):Download
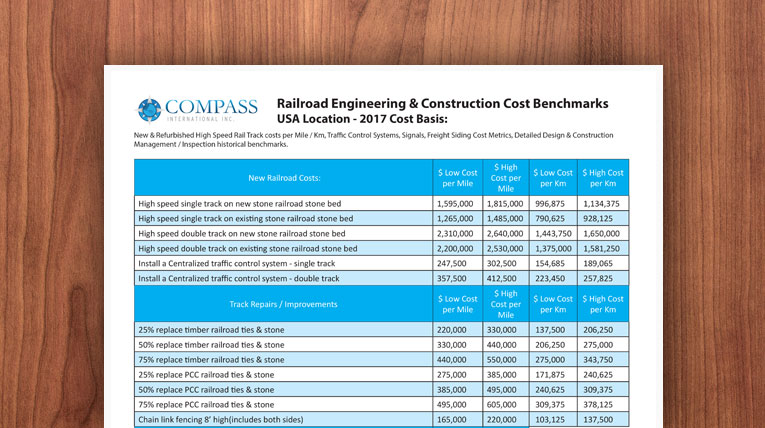
Railroad Engineering & Construction Cost Benchmarks USA Location – 2017 Cost Basis:
New & Refurbished High Speed Rail Track costs per Mile / Km, Traffic Control Systems, Signals, Freight Siding Cost Metrics, Detailed Design & Construction Management / Inspection historical benchmarks.Download
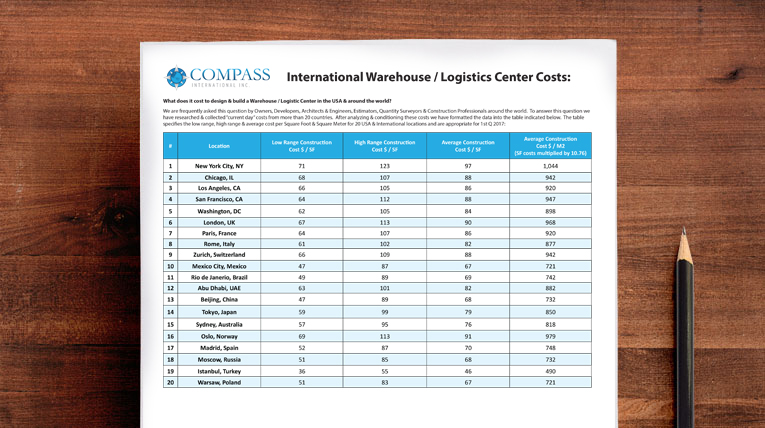
International Warehouse / Logistics Center Costs:
Specifies the low range, high range & average cost per Square Foot & Square Meter for 20 USA & International locationsDownload
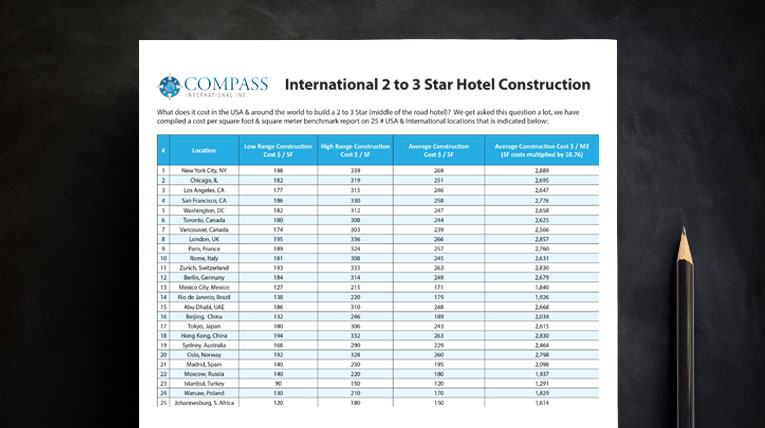
International 2 to 3 Star Hotel Construction
Compiled cost per square foot & square meter benchmark report on 25 # USA & International locations.Download
US Regional Airport Cost Model Benchmarks
This cost model itemizes +/- 15% cost estimating data on the costs of constructing and or upgrading / revamping airport runways, taxiways and aircraft parking stands and ramps.Download
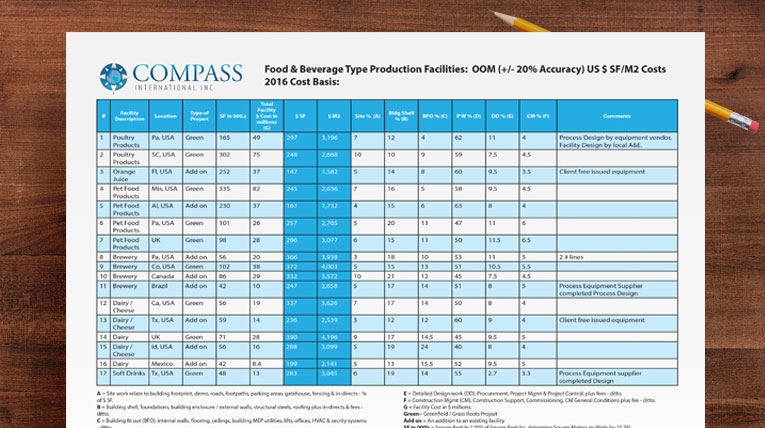
Global Food & Beverage Facility EPC Cost Benchmarks
This cost benchmark report itemizes various Construction, Engineering & CM values for 17 # types of facilities.Download
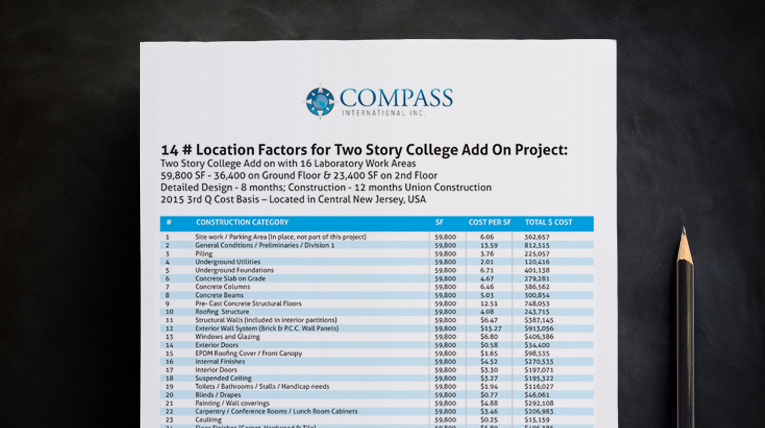
Location Factors for Two Story College Add On Project
Utilize our latest facility cost model for comparing construction costs around the world; you can download this and add it to your personal cost estimating library for your future use. Two Story College Add on with 16 Laboratory Work Areas.Download
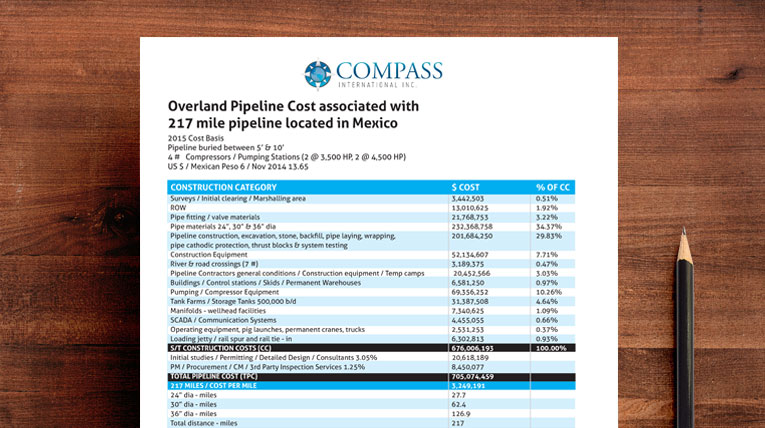
Overland Pipeline Cost associated with 217 mile pipeline located in Mexico
Check out our latest pipelines benchmark data that will assist you in your future estimating efforts.Download
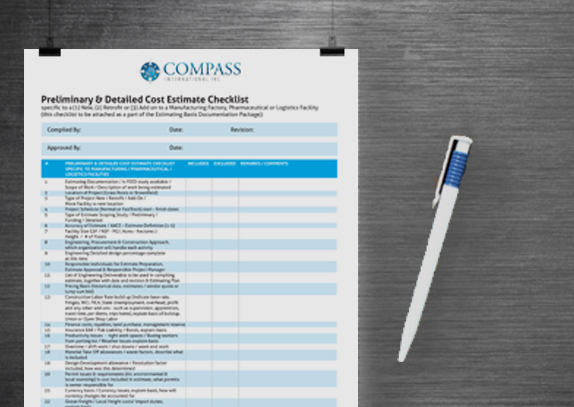
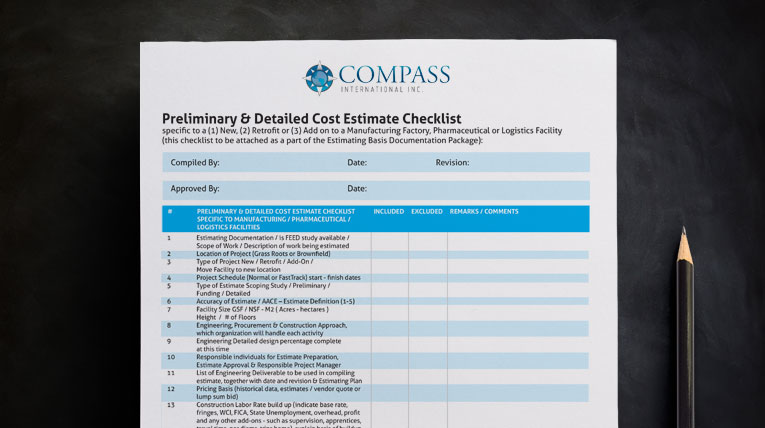
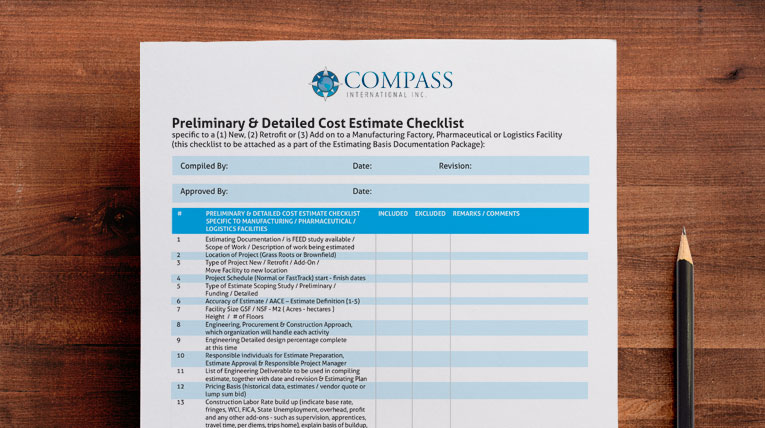
Preliminary & Detailed Cost Estimate Checklist
This comprehensive checklist will ensure that all scope items are captured. Check back regularly as we update these every few months!Download
Commodity Chemical Production Facility Estimating Template
This estimate summary covers all the main construction categories.Download
Chemical Facility Cost Estimate
This real-world cost data format will help you in your estimating efforts. Check back regularly as we update these every few months!Download
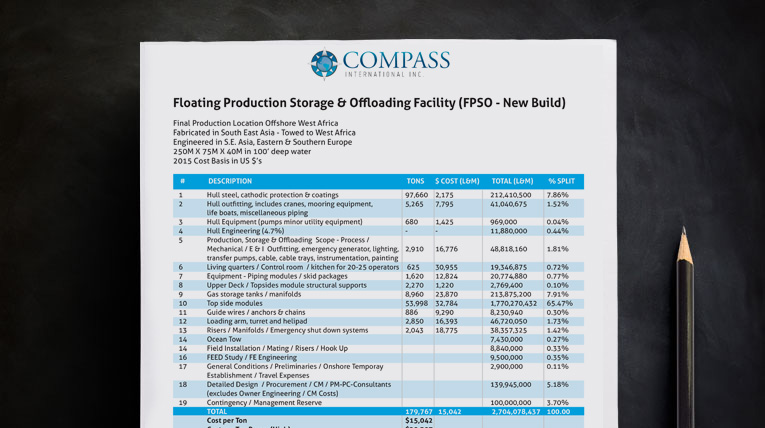
Floating Production Storage & Offloading Facility (FPSO – New Build)
Final Production Location Offshore West Africa. Fabricated in South East Asia – Towed to West Africa. A great benchmark tool for checking various costs per ton.Download